How to Setup VS Code for Debugging C++ on Linux
Published on Mar 06, 2022 by Arun Michael Dsouza
VS Code has gained a lot of traction over the past few years due to its ease of use and extensibility. It offers a wide variety of plugins to use and customize workflows for any language or technology.
One of the most powerful features of VS Code is its debugger. It has Node JS runtime debugging support which can be used to debug JavaScript, TypeScript and other languages that can be transpiled to JavaScript. For debugging languages other than JavaScript, their corresponding debugging extension needs to be installed in VS Code.
In this blog post, we will be looking at how we can set up VS Code to debug C++ on Linux (Ubuntu). The steps are pretty much the same for other operating systems but they have been covered in separate blog posts that you can check out below -
Setting up VS Code for C++ Development
Since C++ is a compiled language, what we first need is a compiler. The compiler will compile the code and execute it, then we can attach a debugger to it and start debugging the code that is being executed.
If you already have gcc or g++ installed on your system, you can open up a terminal window and use these commands to verify if a version of these compilers is installed -
g++ --version
gcc --version
If there’s no C++ compiler installed on your system, you can install the native binaries for gcc and g++ using the following command -
sudo apt install build-essential
Note: In this blog post, we will be using the
g++compiler.
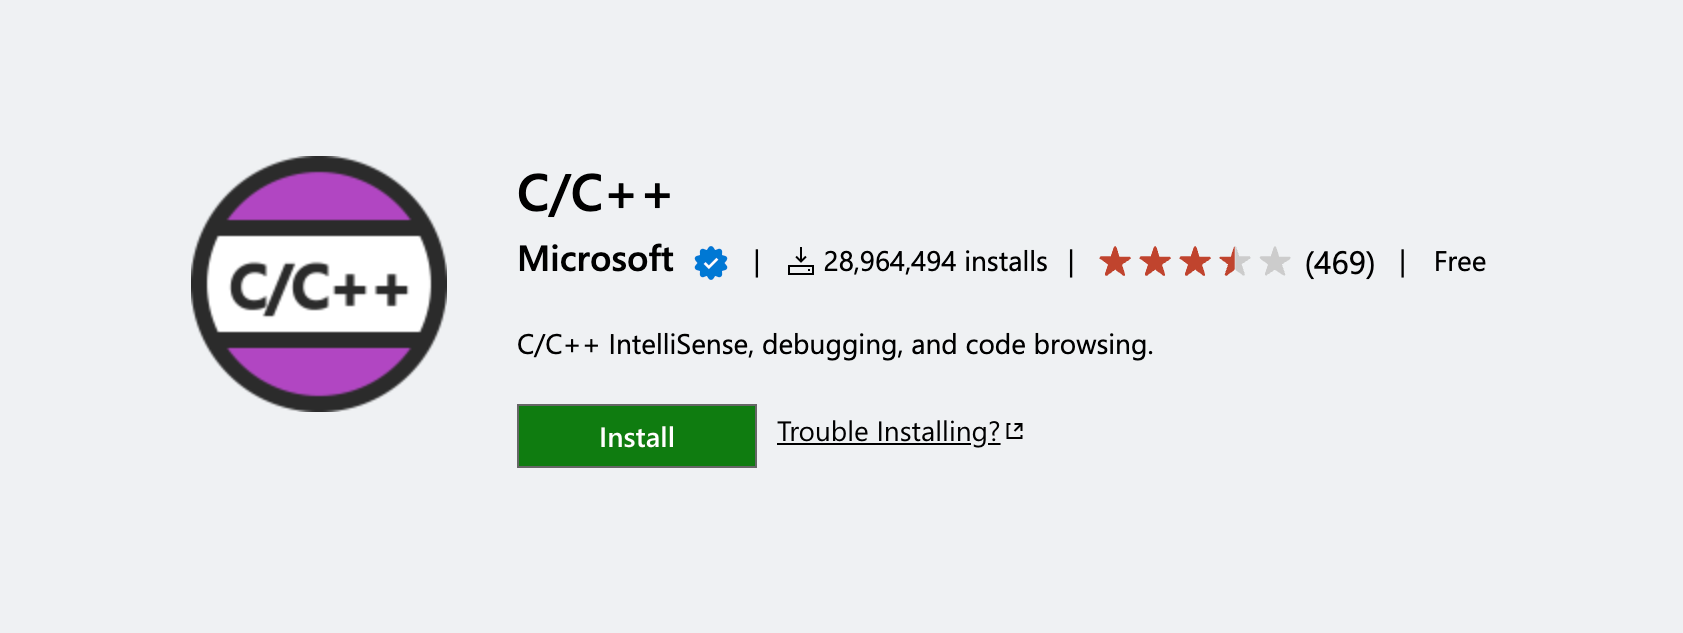
Now that we have a C++ compiler installed, the next step would be to install the C/C++ Extension for VS Code which offers intellisense and debugging support. Once installed restart VS Code.
Creating a C++ Debug Configuration
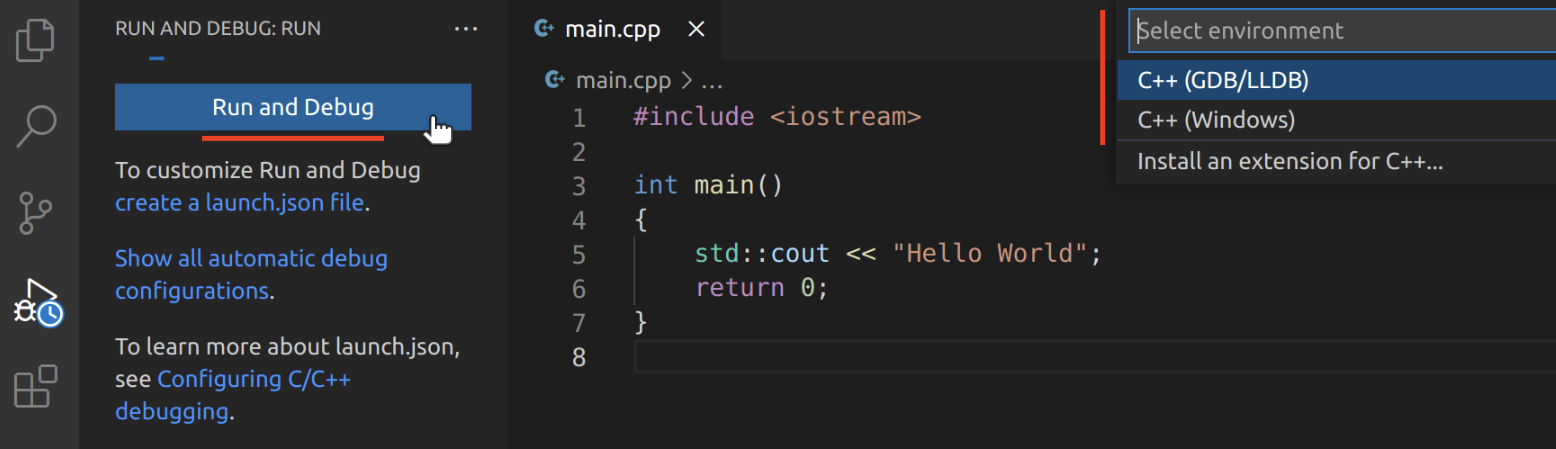
Open the C++ source file that you want to debug in VS Code. To start the debugging process we need to create a debug configuration that will help us in debugging and executing C++. Go to the Run and Debug tab and click on the Run and Debug button, this will open up the environment selection menu. Or you can press F5 alternatively.
VS Code supports the GDB debugger on Linux, so click on the C++ (GDB/LLDB) menu item.
This will open up another menu to select the compiler configuration with a list of supported compilers in the list.
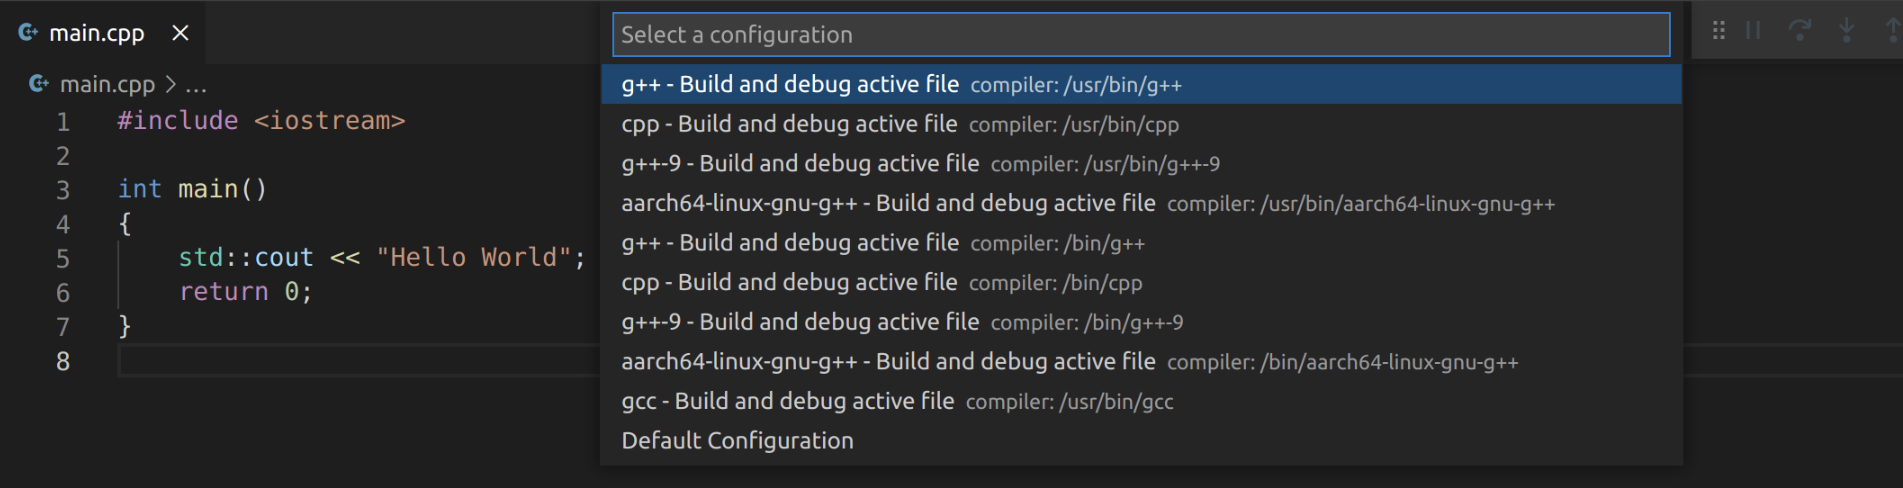
Selecting a compiler will create the debug configuration and save it inside the .vscode directory with two files -
launch.json
 1{
 2  "version": "0.2.0",
 3  "configurations": [
 4    {
 5      "name": "g++ - Build and debug active file",
 6      "type": "cppdbg",
 7      "request": "launch",
 8      "program": "${fileDirname}/${fileBasenameNoExtension}",
 9      "args": [],
10      "stopAtEntry": false,
11      "cwd": "${fileDirname}",
12      "environment": [],
13      "externalConsole": false,
14      "MIMode": "gdb",
15      "setupCommands": [
16        {
17          "description": "Enable pretty-printing for gdb",
18          "text": "-enable-pretty-printing",
19          "ignoreFailures": true
20        },
21        {
22          "description": "Set Disassembly Flavor to Intel",
23          "text": "-gdb-set disassembly-flavor intel",
24          "ignoreFailures": true
25        }
26      ],
27      "preLaunchTask": "C/C++: g++ build active file",
28      "miDebuggerPath": "/usr/bin/gdb"
29    }
30  ]
31}
And tasks.json
 1{
 2  "tasks": [
 3    {
 4      "type": "cppbuild",
 5      "label": "C/C++: g++ build active file",
 6      "command": "/usr/bin/g++",
 7      "args": ["-fdiagnostics-color=always", "-g", "${file}", "-o", "${fileDirname}/${fileBasenameNoExtension}"],
 8      "options": {
 9        "cwd": "${fileDirname}"
10      },
11      "problemMatcher": ["$gcc"],
12      "group": {
13        "kind": "build",
14        "isDefault": true
15      },
16      "detail": "Task generated by Debugger."
17    }
18  ],
19  "version": "2.0.0"
20}
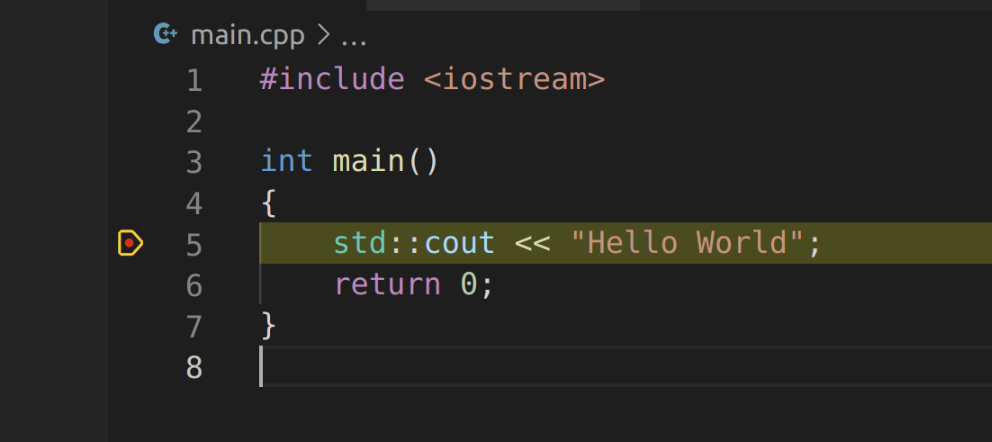
It will also compile the currently opened C++ source file, just make sure that the file is open while selecting the compiler. You will also notice that if you have a breakpoint set, the debug process will stop on it.
Tip: If you want to begin debugging right when the program starts, you can set the
stopAtEntryproperty in yourlaunch.jsonfile totrue. This will stop the program on themain()function.
So there you have it! You can now start building and debugging C++ on Linux with VS Code. If you want to set it up for a different platform you can check out the following blog posts -
If you have any questions or suggestions, please leave a comment down below. Also if you want to stay up to date with the latest happenings at example.com, feel free to follow me on Twitter.
Cheers!

Arun Michael Dsouza
Lorem ipsum dolor, sit amet consectetur adipisicing elit. Veniam recusandae consequatur necessitatibus modi nostrum ullam.